Quick Guide to ASP
Click for Ordering Information
|| Installing || Control
Panel
|| Mouse
Usage
|| Entering
Functions
|| Entering
Data Points
|| Derivatives
& Integrals
|| Function
Storage
|| Modifying
Functions
|| Copying &
Pasting
||
 
Click on the symbol in the text, to get back to the top of the page.

What is ASP?

ASP, Algebraic Scratch Pad, is Microsoft Windows software designed as a two-dimensional graphic aid for mathematical and engineering applications. ASP's extremely simple Windows ® interface facilitates the two-dimensional graphing of individual points and/or explicit functions of a single variable.

back to the top  Installation:

The installation is handled entirely by the installer utility which comes with the distribution. The installer ("Install.exe") runs automatically once the CD is placed in the CD drive.

If the AutoRun has been disabled / not enabled, the installer can be accessed through:

  • Windows 95/98:
        START | RUN | A: InstallAsp.exe
       
  • Windows NT/2000:
            FILE | RUN | A: InstallAsp.exe

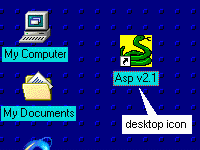
The installer creates a desktop icon to facilitate later use of the program.
To run ASP, double click on its desktop icon or through:     START | Programs | Asp | Asp v2.1

back to the top  The control panel:

The control panel, which is shown in a vertical band on the right hand side of ASP's main screen, has the basic access to the different features and functions.

The buttons in the control panel include:

Auto


Cycles through:
Auto - graphing on automatically selected x,y ranges.
Limits - graphing within user specified range limits.
x%/y% - graphing on equal scale x, y axis.
Close AllRemoves ALL function graphs from the screen
Close FuncRemoves the most current or the selected (highlighted) function from the screen.
ColorsTo access palettes to set background and trace colors.
D'Graphs the derivative of the most current or selected (highlighted) function.
Delete ItemTo delete symbols or parameters from an on-screen algebraic expression.
Ext Axis


Toggles between:
Ext Axis - Display of external x,y axes.
Int Axis - Display of (0,0) origin x,y axes.
Extra DataTo enter individual data points to be plotted.
Font size  To increase/decrease font size.
+ Grid / - GridIncludes/Removes grid from screen.
HelpAccess to dictionary of recognized functions and operators.
Inv'Graphs the inverse of the most current or selected (highlighted) function.
LanguageTo set language for the display (English or Spanish).
Line W  To increase/decrease trace width.
NotesTo access on-screen interactive text display.
PrintTo print current screen via printer connected to the system.
ResetRecovers original x,y ranges.
SetAllows the user to enter by typing, the range of x and y to display, when in the Limits option.
Verbose PUToggles between:
Verbose PU - show specifics af all functions on screen.
Terse PU - show local x,y position, at user's inquiry.
X Range  To increase/decrease x range limits.
Y Range  To increase/decrease y range limits.
]To numerically evaluate the integral of the selected function within specified limits. Numerical values are expected in the From: and To: boxes (no operations are allowed in the fields for the current ASP version).

back to the top  Notes on using the mouse buttons

  • All control panel buttons are accessed by left mouse button clicking.
  • The on-screen expressions that identify each graph can be dragged around to a convenient position by left mouse button usage.
  • By left mouse button clicking anywhere on the screen, the user gets information on the values of all functions plotted, at and around the selected x coordinate (when the option Verbose PU is shown in the control panel).
  • The user can select any of the functions plotted on the screen by right mouse button clicking on any of the characters of the function's on-screen textual expression. By clicking to the right of the equal sign the user selects the function, or a particular parameter or symbol that he/she wants to modify (the character is highlighted). By clicking to the left of the on-screen expression, the user can edit the full algebraic expression.
  • By right mouse button clicking on the screen and dragging the cursor, the user can select a subsection of the display for zooming. Conversely, by right mouse button clicking anywhere on the background of a zoomed graph, the user goes back to the original display settings.

ASP's Usage:

back to the top  To enter a function:

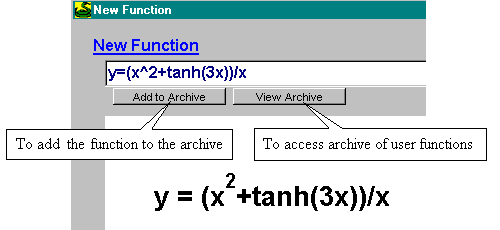
Click on New Func to access the window where the function will be typed. The window shows two fields. In the upper one the user types the expression. The program's interpretation of the typed expression is shown simultaneously in the lower field. The expression shown in the lower field will accompany the trace of the function on the graphics screen. The user can drag it around to place it in any convenient screen location. The typing of the new function should start with y=....(explicit function of x).
 
Examples:
To enter the function

The user types: y=e^(-sin(3x+7))+2x^2-6x . When finished typing, the key "Enter" should be pressed or the button Done should be clicked.

To enter the function

The user types: y=(ln(5x^3-2)+4/(x+2))^(3/2) . When finished typing, the key "Enter" should be pressed or the button Done should be clicked.

back to the top  To enter functions with "partitioned domain" (piecewise functions):

Click on New Func to access the window where the function will be typed. In the upper field the user types the expression. By the use of the keys: {, }, <, : and ; , the user specifies:

  •  1) That a partition domain is being entered in the expression within the { }.
  •  2) The range of variation of x by giving the lower and upper bounds (always in increasing order).
  •  3) Where the actual expression for the function starts for the specified domain interval (by using :)
  •  4) that another domain and function for that domain follows (by the use of ;).
 
Example:
To enter the function:

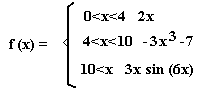
The user types: y={0<x<4:2x;4<x<10:-3x^3-7;10<x:3x*sin(6x)} . When finished typing, the key "Enter" should be pressed or the button Done should be clicked. The symbols used in this expression mean:

back to the top To retrieve functions that the user has displayed during the session

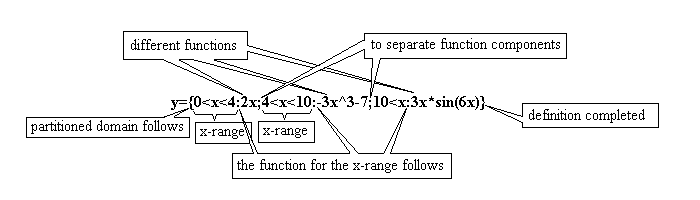
The user can retrieve from memory any of the functions that he or she has typed and graphed previously. This saves typing effort when creating a new function, for which just a few terms or parameters are different from a previously typed one. After pressing New Func, to start a new entry, by clicking on the up and down arrows of the keyboard, the user scrolls over all the textual expressions of the functions previously entered. The text is automatically entered in the upper and lower fields of the New Func window, ready for editting or direct graphing.

back to the top  To enter individual (x,y) data points to be plotted

By clicking on Extra Data in the control panel, the user accesses a window that allows him/her to enter the individual points one by one, or to load a file with the data information.

Individual data is entered on the top field of the window. A carriage return (Enter key) is required to end the data entry. The size, color and symbol to be used for the data can be specified on the same line if the user wants different options from the ones given by default. Default values are: size = 1, symbol = + and color specification the ones defined by the user from the color palette for the functions but in inverted order.
 
Examples:
To enter the pairs: (3,4.5), (0.2,4) and (5,3.9) the user types:

plotxy 3 4.5 ( data will be plotted with default values for size, symbol and color )
plotxy 0.2 4 color 2 symbol * ( data will be plotted in same color as function #2, with symbol * )
plotxy 5 3.9 symbol x size 10 ( data will be plotted with symbol X and large size )

on the top field of the window and ending each line by pressing the Enter key or clicking on the Add button on the upper right of the field. By this action the data is transferred to the lower field and accumulated there until the user clicks on Done to have the points plotted on the screen.

Instead of entering the data one by one with the plotxy option, the user can create a file with just the pairs (x,y) that need to be plotted and invoke the file from the Extra Data window.
 
Example:
The user has a file which he/she named "mydata.txt" with the following pairs (x,y) to plot:  

-2 0.05
1.05 1.62
2.3 3.7
5.1 7.41
6.03 9.27
10.2 -2.34
12.03 -43.2

The user types: plotxyfile mydata.txt color 2 size 4 symbol o finishing with a carriage return (Enter key) or by clicking on the Add button on the upper corner of the top field. The line is transferred to the bottom field, and the user clicks on Done to have the data drawn on the screen.The pairs (x,y) will be plotted on the screen, with o as the symbol on size 4, and all points with the color set from the palette for function # 2.

By typing joinxyfile mydata.txt (option joinxyfile instead of plotxyfile), and proceeding as described in the paragraph above, lines will be drawn joining the data points in the order they appear in the specified file.

While in the Extra Data window, the user can select individual lines (by clicking on them in the lower field), and edit them ( by clicking on the Edit button) to introduce modifications.

back to the top  To modify parameters of a function that has been graphed

  • By right mouse button clicking on the parameter to be modified, the selected parameter is highlighted. By using the four pair of up/down arrows on the control panel, the user can vary the highlighted value in steps of tens, ones, tenths or hundredths as indicated below:


  • The user can also edit the function he/she wishes to modify, by right mouse button clicking on the "y" at the left of the equal sign of the chosen function. This action opens the text editting window to the user (the same window used when entering the function). The user can modify the current function by editting the top field of the editting window.

back to the top  To graph the derivative, the inverse or the integral (for the x-range shown on the screen) of a selected function:

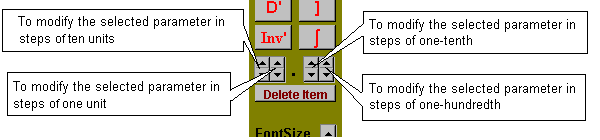
The user selects the function by right mouse button clicking on its explicit expression (this highlights one of the function's parameters). The user clicks on the appropriate control panel button for the desired operation.

back to the top  To store user defined functions:

  • All functions typed and entered by the user during an ASP session, are automatically stored by the program in the order they were entered. The user can access them back during that same session, by clicking on the up and down arrows of the keyboard, while in the "new Function" window.
  • ASP allows the user to store functions in a text file, for subsequent use, at the user's request. This is done by clicking on the Add to Archive button in the "New Function" window, once the function has been typed. The user can retrieve any of the functions that have been saved, by clicking on the View Archive button, and then selecting the desired function with a click. The functions are saved in simple text file, so they can be modified with any standard editor.

back to the top  To copy portions of the ASP's graphic screen:

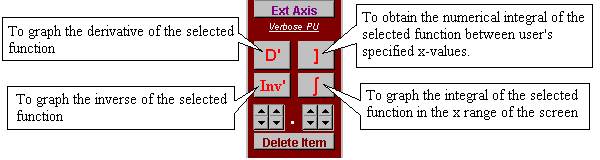
The user may want to use graphics produced by ASP as pictures by themselves, or as ilustrations in text documents. ASP allows to select a portion of the graphic screen determined by the user, and to copy it to the "clip-board". The image copied is handled like a bitmap image, and can be used with several Windows'® utilities like "Paint", "Word-Pad", "Word", "Imaging."

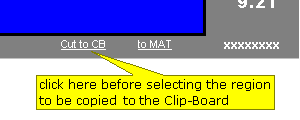
The process is very simple, and starts by left mouse button clicking on the title "Cut to CB" (Cut to Clip-Board) at the botton right of the graphic screen. Once this title is highlited, the user defines the area (rectangle) to be copied by pressing the right mouse button at one of the corners of the region of interest and dragging the mouse while holding the button down until the rectangular section has been defined. At the release of the right mouse button, the selected area is copied to the Clip-Board, and the highlighting on the title "Copy to CB" would have disappeared.

back to the top  Accessing MAT:

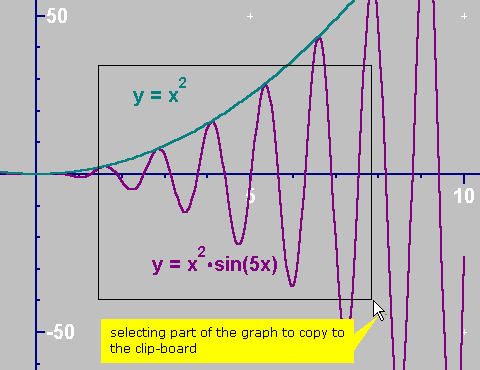
The utility for matrix operations and methods, can be accessed by clicking on the title "to MAT" at the botton right of ASP's main screen.
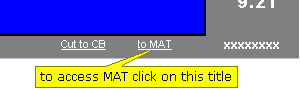